
Rethinking UEBA for the Modern Cloud

User and Entity Behavior Analytics (UEBA) has traditionally been about heuristics, thresholds, and a lot of manual investigation. In a world where identity fabrics span SaaS, cloud, and homegrown apps, and attackers move faster than ever, UEBA needs to be faster, more context-rich, and easier for analysts to act on. RunReveal approaches UEBA as a modern, progressive capability: unified telemetry, high-performance analytics, composable detections, and AI-assisted investigation that together reduce noise and dramatically shorten time to answer.
The underlying idea was never the problem. Compare a user's behavior to their own history instead of a one-size-fits-all rule, and you catch things the rules miss. What broke it was the execution: siloed data, slow queries, brittle rules, and opaque scoring. Here's how UEBA actually works under the hood, why traditional implementations struggle, and how we approach it at RunReveal.
The core insight: Normal is per-entity, not global
Traditional detections ask one question: Did this event match a known-bad pattern? UEBA asks a different one: did this event deviate from what's normal for this specific user or entity?
That distinction matters more than it sounds. A login at 2am from another country is suspicious for your accounting team, but it's completely routine for a developer who pairs with a distributed team in Europe. A global rule fires on both and trains your analysts to ignore it. A per-entity baseline knows the difference.
A useful behavioral profile covers a lot of ground for each user and service account: Typical login hours and days, normal countries and source IPs, known devices, which applications and cloud regions they actually touch, average daily download volume, average API call volume. The interesting signal is almost never one dimension. It's the combination: This user has never accessed the finance bucket, never logged in from this country, and just downloaded ten times their daily average.
How baselines actually work
There's no magic here, just statistics applied consistently. You observe an entity for some period, typically 7 to 30 days, and extract features from that activity: login times, source locations, resources accessed, data volumes, process execution patterns. For each feature you compute a mean and standard deviation, and you define normal as some band around the mean. When an observation lands two or three standard deviations out, that's an anomaly worth scoring.
Take a user whose logins cluster between 7am and 9pm, centered around 1pm with a standard deviation of about three hours. A login at 2am isn't just "after hours." It's eleven standard deviations from that user's mean, which is a statistically loud event. The same login for a night-shift SRE wouldn't register at all, because their baseline is different.
The hard part was never the math. It's doing this continuously, for every user and service account, across every log source, without the queries falling over. Which is where most implementations start to crack.
Where traditional UEBA breaks down
Most UEBA failures trace back to the same root cause: The data was never in one centralized place to begin with.
Your identity signals live in Okta, your infrastructure activity lives in CloudTrail, and your application logs live in five different places, two of which are custom apps that don't speak any standard format. A behavioral question like "what did this contractor account touch in the 48 hours before it was disabled" requires correlating across all of them, and most SIEMs simply can't. So they baseline behavior within a single log stream and call it UEBA, which is a bit like watching one hallway camera and claiming you have building-wide surveillance.
Even when the data is centralized, legacy SIEMs make it painfully slow to query. Behavioral analysis is inherently historical. You're comparing today's activity against weeks or months of precedent, which means scanning serious volumes of data. If that query takes twenty minutes, analysts stop running it. The tool quietly becomes shelfware.
And then there's the trust problem. Early UEBA products leaned hard on machine learning that produced risk scores without showing the math. When an analyst can't see why a user scored an 87, they can't validate the alert, can't tune it, and eventually stop believing it. Tuning fatigue sets in, alerts get muted, and the one real incident gets buried with the noise.
The incumbents each got part of this right and paid for it somewhere else.
Exabeam pioneered the security timeline, stitching events from disparate sources into a per-user story with ML-driven session risk scoring. It works, but it's expensive and typically needs serious professional services engagement before the tuning settles down. Splunk's UEBA runs as a separate product that ingests from your Splunk indexes and stores its behavioral models off to the side, which means a cost multiplier and an experience disconnected from where your analysts already work.
The common thread: behavioral analytics gets treated as a bolt-on product or a DIY project, separate from the data layer it depends on. That separation is exactly what makes it slow, expensive, and hard to trust.
RunReveal's progressive UEBA model
Because RunReveal normalizes everything into a unified logs table on ClickHouse, with entity attribution on every event, behavioral analytics becomes something you build with SQL and detections rather than something you buy as a sidecar. The architecture is four layers, and none of them are black boxes: A baseline layer, a scoring layer, an aggregation layer, and an investigation layer.
Entity-centric data model
RunReveal normalizes telemetry from identity providers, cloud platforms, SaaS apps, and custom sources into a unified logs table where every event carries entity attribution. A login in Okta, a role assumption in AWS, and an API call in your production app all resolve back to the same actor. That attribution is the foundation everything else sits on. Without it, "behavior analytics" is just per-source anomaly detection wearing a trench coat.
We also keep the raw logs alongside the parsed fields. Parsed events power fast detections and dashboards; raw events preserve the full context you need when an investigation gets weird. Anyone who's been mid-incident and discovered their pipeline dropped the one field they needed knows why this matters.
The baseline layer: Materialized views, not on-demand scans
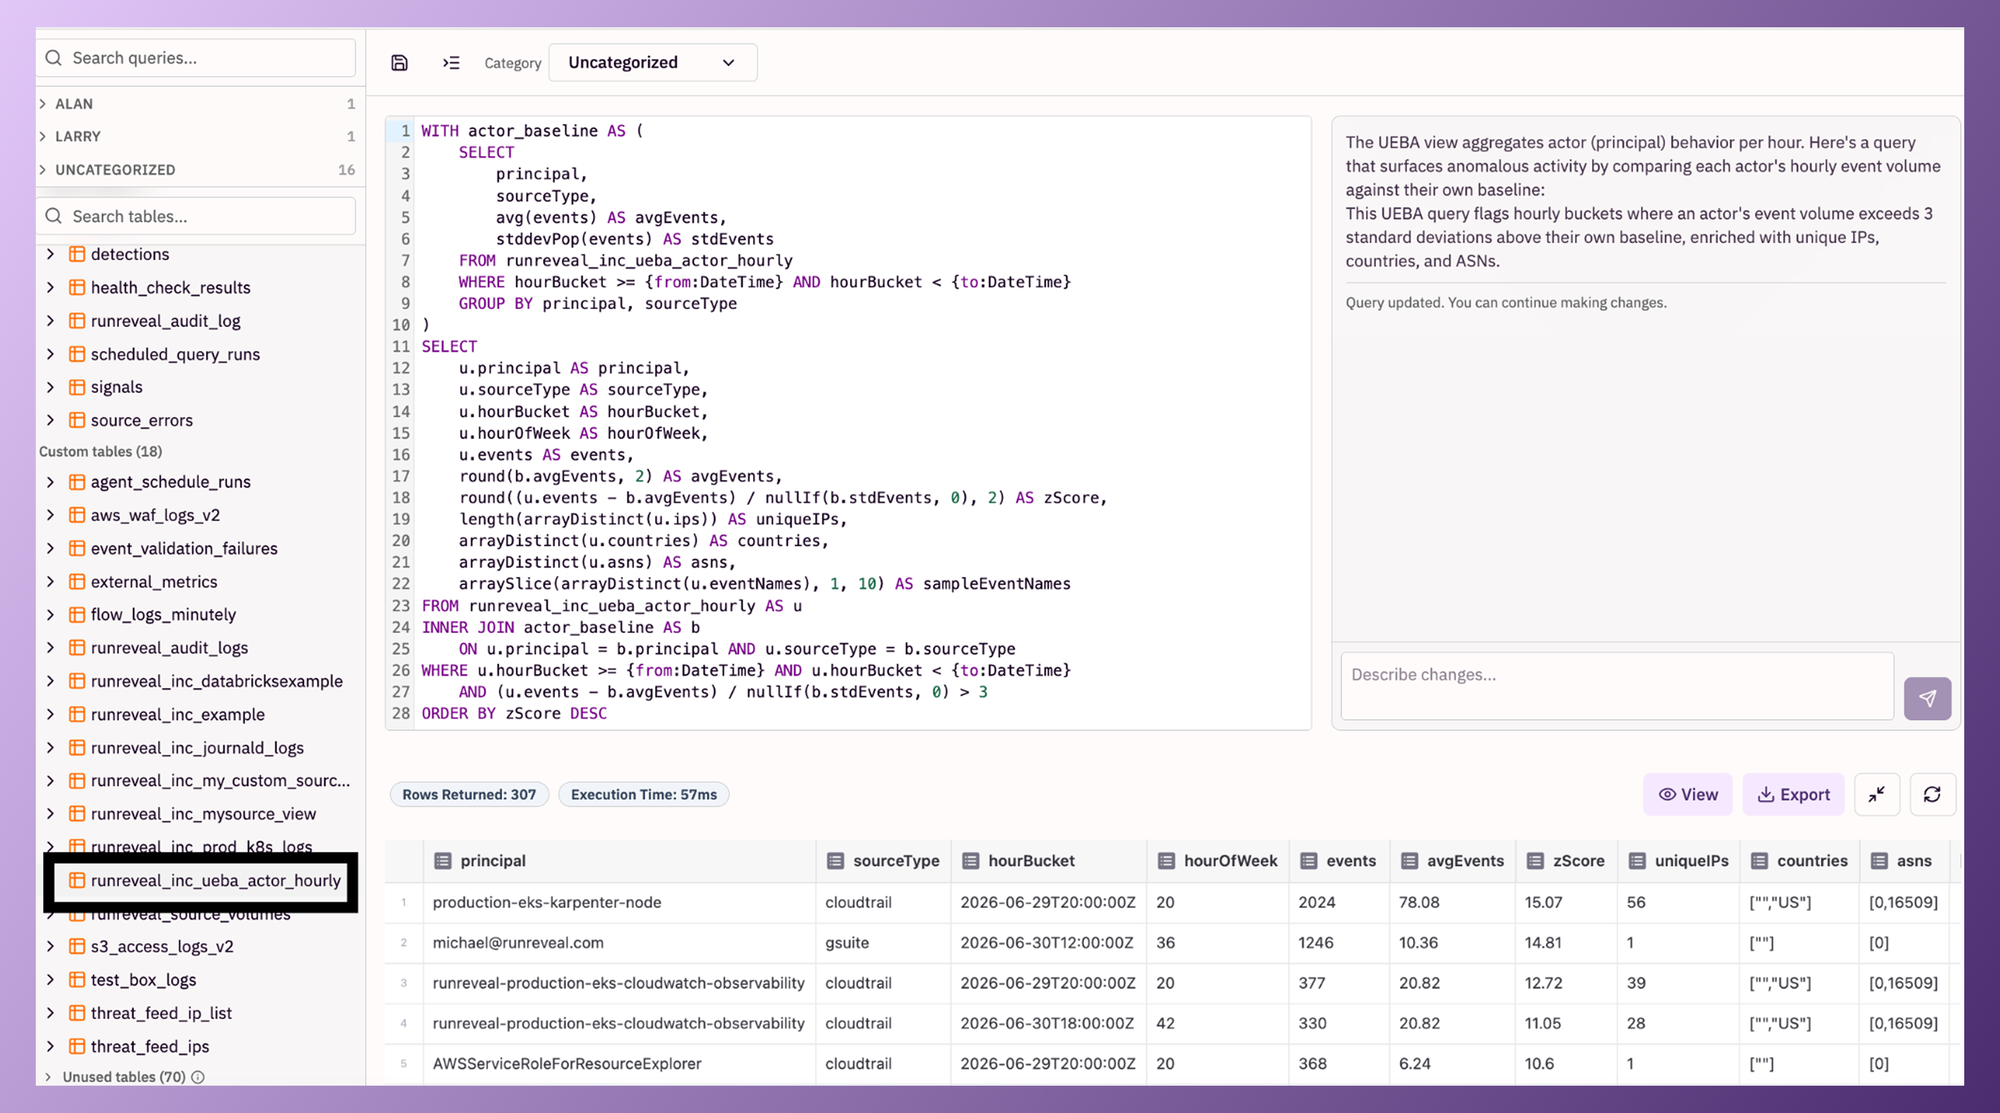
Baselines aren't something you want to compute on demand, scanning months of raw logs every time an analyst asks a question. That's how you end up back at the "queries take twenty minutes" problem. Instead, RunReveal maintains a materialized view purpose-built for UEBA behind the scenes. As events land in the unified logs table, ClickHouse incrementally rolls them up into per-entity behavioral aggregates in the background, a table like runreveal_inc_ueba_actor_hourly, pre-aggregated per actor, per source type, per hour.
Customers don't write or manage that materialized view; RunReveal does. What customers get is a fast, queryable table sitting on top of it. That's the part worth dwelling on, because it changes what's actually possible to ask. Baseline computation isn't a nightly batch job that's stale by the time you need it, the view stays current as new events arrive. And it decouples the cost of baselining from the cost of querying. The expensive part (scanning historical activity) happens once, continuously, in the background; the cheap part (comparing a new event against the rollup) happens at query time, in milliseconds. That's what makes it realistic to maintain live baselines for every user and service account at once, instead of a sampled subset.
This is what a customer-facing query against it actually looks like, real SQL an analyst can read and adjust, not a model you have to take on faith. Here it is flagging actors whose current hourly event volume exceeds three standard deviations from their own baseline:
The scoring layer: Signals vs. alerts, with the math in the open
It's worth being precise about a distinction that a lot of UEBA tooling blurs: A signal is not the same thing as an alert.
A signal is a single observation worth recording: A login from a new country, a download that's larger than usual, an MFA disablement. On its own, a signal usually isn't actionable since it's just a data point. An alert is what you get when signals accumulate into something that crosses a threshold and genuinely warrants analyst attention.
RunReveal collects both as logs in the same underlying table, rather than only persisting the alerts and discarding the raw signal stream. That has two practical benefits. First, it gives you historical context: when an analyst is investigating an alert, they can pull every signal that contributed to it, going back as far as the data retention allows, not just the moment it crossed the threshold. Second, it makes the baselines themselves better over time, because the signal history is what the baseline and scoring layers are computed from in the first place. Throwing away signals after they're scored throws away the raw material future detections need.
That split shows up directly in the product. The alerts view filters across both: "All" shows the full stream, with "Signals" and "Alerts" as separate, selectable lenses on the same underlying log data, so an analyst can pivot between the raw observations and the things that actually crossed a threshold without switching tools.
RunReveal is built on ClickHouse, and the practical consequence is that the historical queries UEBA depends on actually run in seconds, not coffee breaks. Comparing this week's login geography against six months of history, hunting for service accounts that suddenly started touching new APIs, correlating token creation events with privileged actions across terabytes of logs: these go from "scheduled batch job" to "thing an analyst does interactively during triage."
But speed isn't the only thing ClickHouse buys you here, it's also transparency. RunReveal uses ClickHouse's native statistical and mathematical functions (avg, stddevPop, quantile, and similar) directly in the SQL that computes baselines and scores. That means the "model" behind a risk score is the same query an analyst can open, read, and modify. There's no opaque model file, no hidden feature weighting you have to take on faith. If a threshold feels too sensitive for a particular team or entity type, you change the number in the query. If you want to score on quantiles instead of standard deviations for a feature that doesn't follow a normal distribution, you swap the function. Control and clarity come from the fact that the math is just SQL, not a black box you're hoping was trained on data that resembles yours.
That speed and transparency together change analyst behavior. When asking a question is cheap and the answer is explainable, people ask more questions. Hypotheses get tested instead of shelved. Custom entity views, like a single pane covering admin activity across Okta and CloudTrail, become things teams actually build and use because the queries behind them return fast enough to be part of a daily workflow.
In practice, scoring compares incoming events against the baseline layer in real time. New country? Add points. Login outside normal hours, measured in standard deviations from that user's mean? Add points. Download five times the daily average? Add more points. Each scored event lands in a risk table with full provenance back to the original log, and is itself retained as a signal, not just folded into a score and discarded.
The aggregation layer: Composable detections with autotuning
A single unusual event is rarely an incident. An impossible-travel login is usually a VPN; a new API call is usually a deploy. But an unusual login followed by token creation followed by privileged API calls from a service account that has never made them before, that's a story worth waking someone up for.
RunReveal's detections are correlation-first. Instead of writing brittle single-source rules that fire on every individually odd event, you compose signals across identity, cloud, and application logs into detections that only fire when the combination is genuinely suspicious. Each component signal can be modest on its own. Together they produce high-confidence alerts, which is the entire point of behavior analytics.
This is also where the aggregation layer earns its name: It rolls scores up per entity over a decaying window, which is what turns weak signals into strong ones. A new-country login a week ago is worth a fraction of its original score today. An MFA disablement two days ago still carries most of its weight. An admin privilege grant this morning counts in full. Individually, each of those events would drown in a queue. Accumulated with time decay, they push one specific user over a threshold while everyone else's routine oddities fade out.
Because every signal and every scored event is retained with full provenance, detections aren't static once you write them. RunReveal can replay a detection's logic against historical signal and alert data to see how its thresholds would have performed: How many true positives it would have caught, how many false positives it would have generated, and how a proposed threshold change shifts that balance. That's the autotuning loop, adjusting detection sensitivity based on what actually happened historically, rather than guessing at a number and waiting weeks to find out it was wrong. Thresholds are tunable, logic is inspectable, and iteration happens in minutes against real history rather than in support tickets against a vendor's roadmap.
Here's an actual detection running this pattern against an aggregated z-score view, comparing each actor+source-type pair's most recent full day of activity against its own 30-day daily mean:
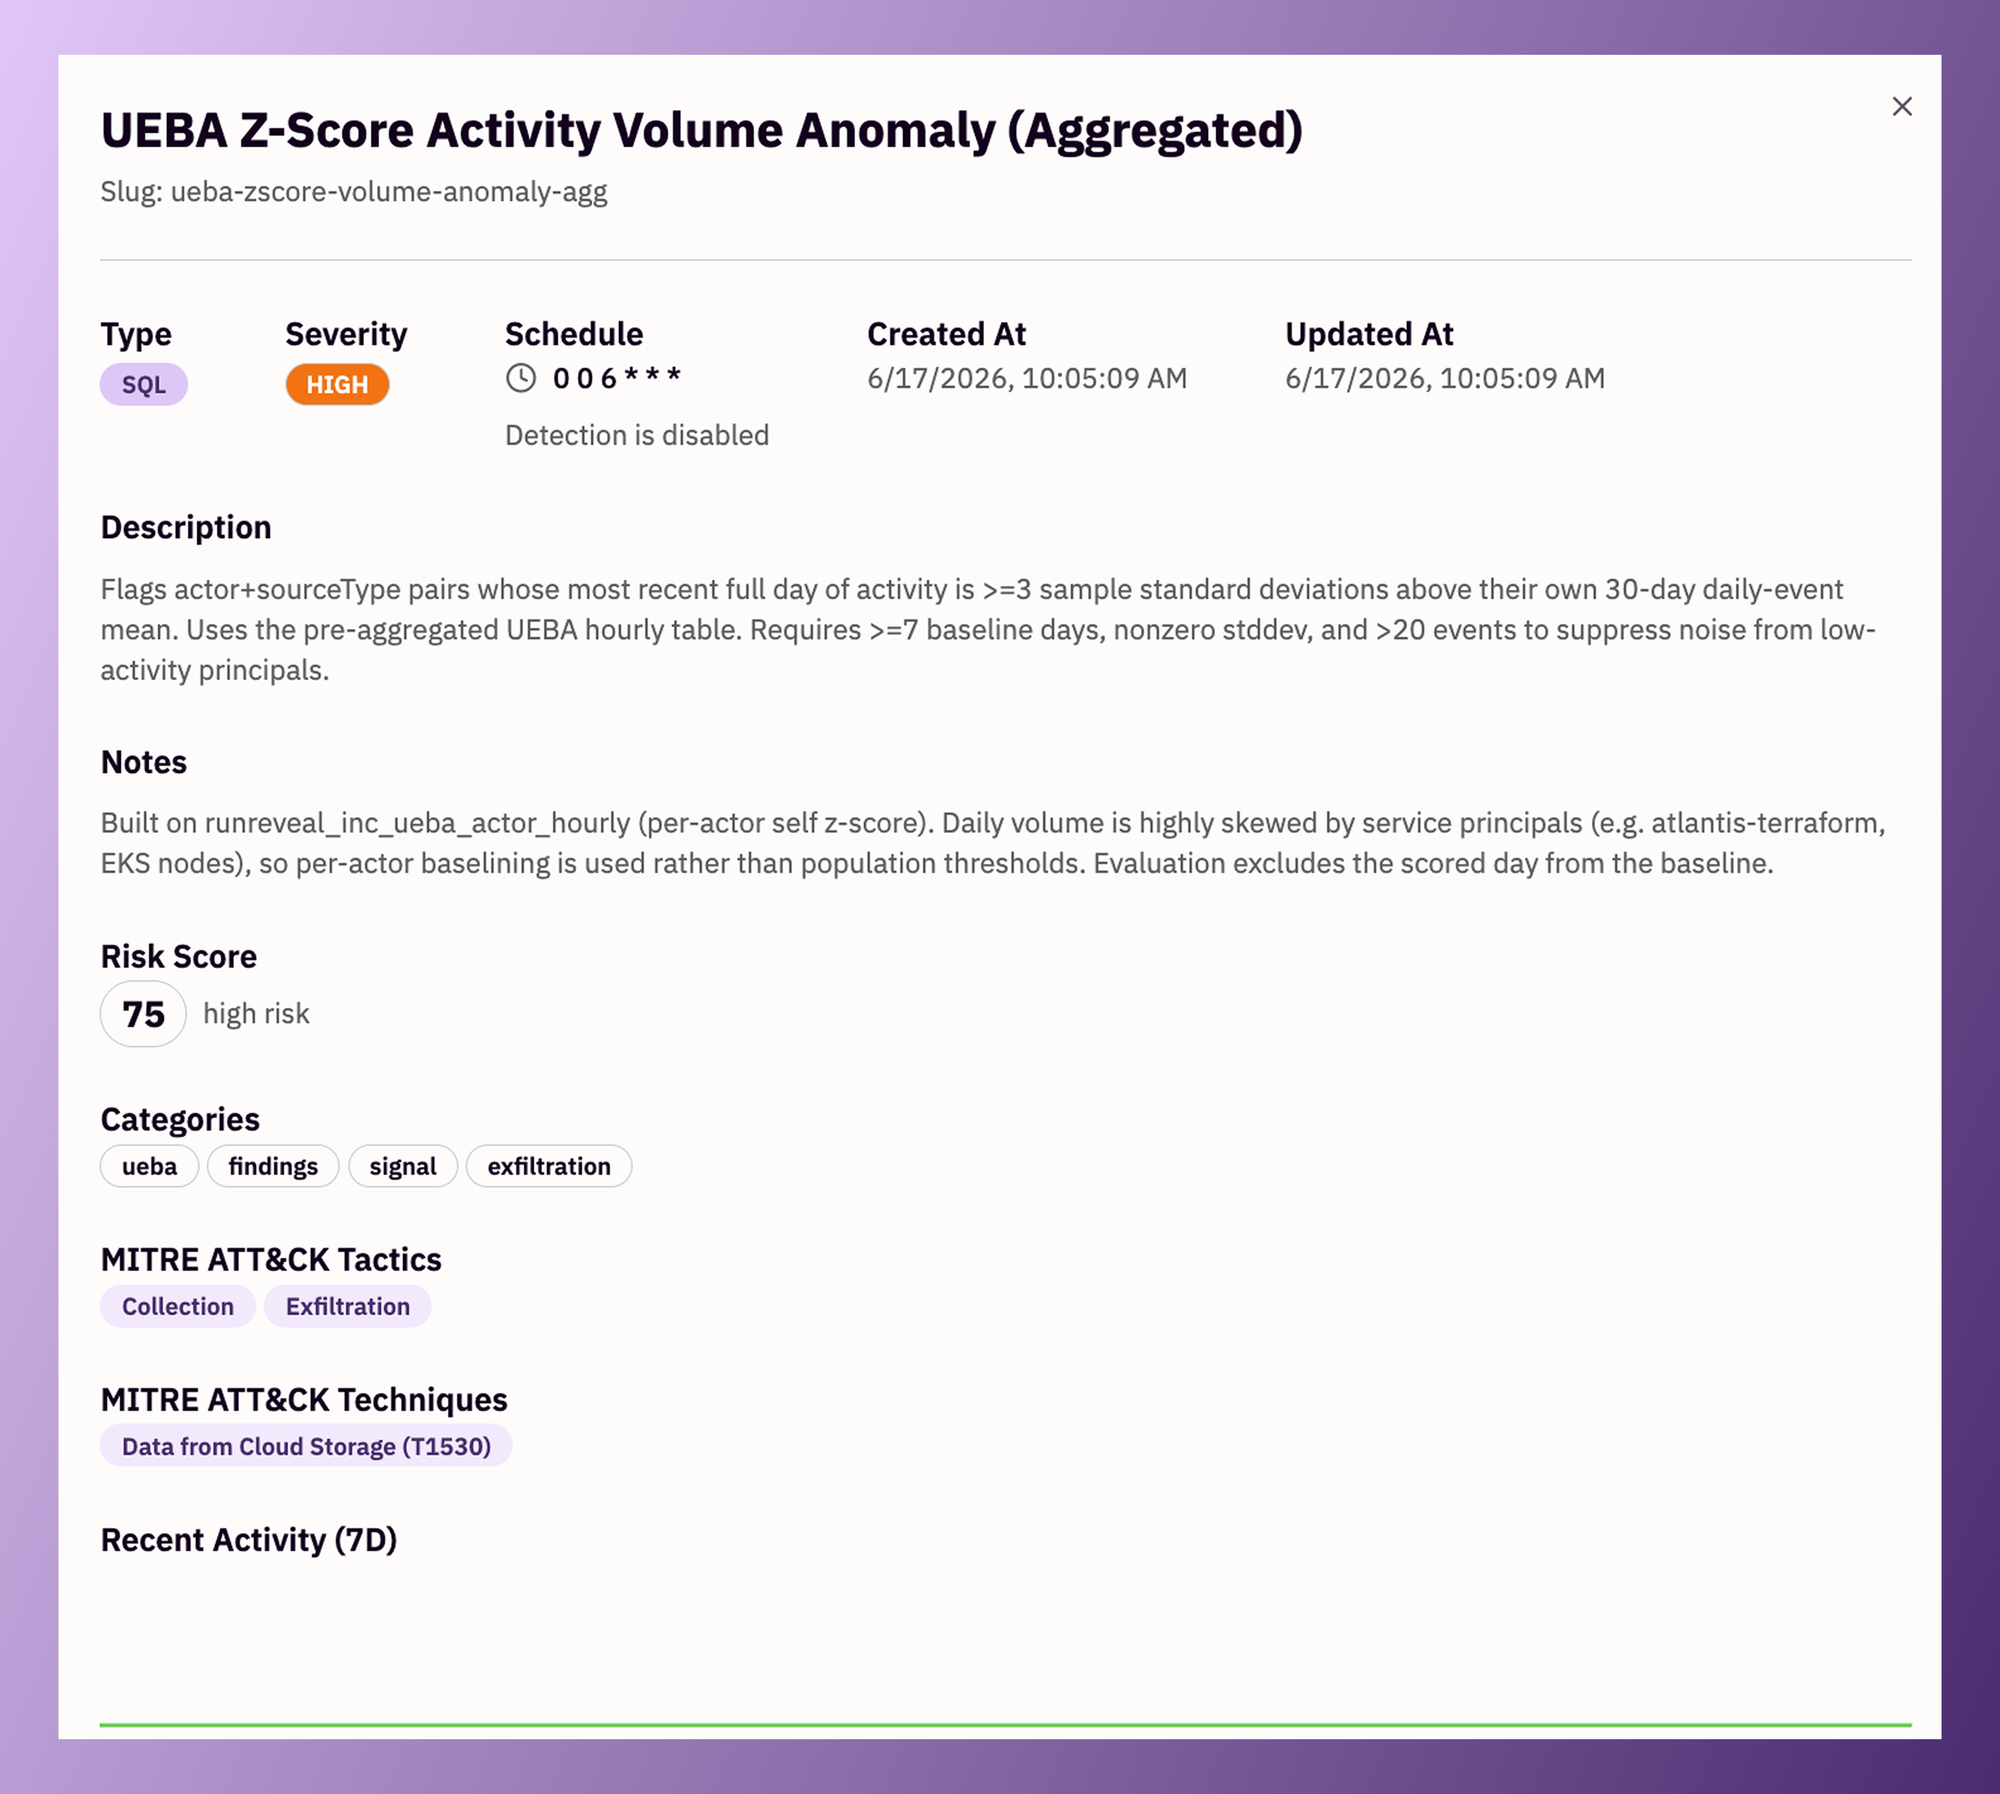
And here's the same logic surfaced as a registered detection, with the thresholds, MITRE mapping, and tuning notes that make it auditable rather than opaque:
WITH daily AS (
  SELECT principal, sourceType, toDate(hourBucket) AS d, sum(events) AS ev
  FROM runreveal_inc_ueba_actor_hourly
  WHERE hourBucket >= {from:DateTime} AND hourBucket < {to:DateTime}
  GROUP BY principal, sourceType, d
),
baseline AS (
  SELECT principal, sourceType, avg(ev) AS meanEv, stddevSamp(ev) AS sdEv, count() AS daysSeen
  FROM daily WHERE d < toDate({to:DateTime}) - 1
  GROUP BY principal, sourceType
),
latest AS (
  SELECT principal, sourceType, sum(ev) AS dayEv
  FROM daily WHERE d = toDate({to:DateTime}) - 1
  GROUP BY principal, sourceType
)
SELECT l.principal, l.sourceType, l.dayEv,
       round(b.meanEv,1) AS meanEv, round(b.sdEv,1) AS sdEv, b.daysSeen,
       round((l.dayEv - b.meanEv)/nullIf(b.sdEv,0),2) AS zscore
FROM latest l INNER JOIN baseline b USING (principal, sourceType)
WHERE b.daysSeen >= 7 AND b.sdEv > 0 AND l.dayEv > 20
  AND (l.dayEv - b.meanEv)/nullIf(b.sdEv,0) >= 3
ORDER BY zscore DESC
The same detection registered with thresholds, MITRE ATT&CK mapping, and tuning notes, fully auditable rather than opaque.
Notice the detail in the Notes field: daily volume is heavily skewed by service principals like Terraform runners and EKS nodes, so the detection deliberately baselines each actor against itself rather than against a population-wide threshold. That's the kind of judgment call that's easy to make and easy to verify when the logic lives in inspectable SQL with documented reasoning attached, and effectively impossible to audit when it's buried in a trained model's weights.
The investigation layer: AI-assisted and reproducible
This is where most of the "AI-powered UEBA" marketing falls apart, so let's be specific about what we mean.
An analyst can ask RunReveal a plain-language question like "what did this user do yesterday across all our systems" and get back an answer. But the answer comes with receipts: the actual queries that ran, the tables they hit, and the specific events that support each conclusion. Every step is reproducible. If the AI's reasoning is wrong, you can see exactly where, and fix it.
When an entity crosses the threshold, RunReveal pulls the full timeline and produces a narrative an analyst can act on: this user logged in from a country they've never appeared from, disabled MFA, then pulled 10GB from a finance bucket they'd never touched. And critically, the narrative comes with receipts: the queries that ran, the tables they hit, the specific events behind every sentence. If the reasoning is wrong, you can see exactly where. Nobody is asked to trust a score they can't audit.
That transparency is what makes AI useful in a SOC instead of just impressive in a demo. Senior analysts can validate and codify the AI's investigation paths into playbooks. Junior analysts get a fast on-ramp to investigations that would otherwise require years of query-language fluency.
Proving it out
Proving this out doesn't require a six-month deployment. A typical RunReveal POC looks like this:
- Pick two to four sources (say, Okta, CloudTrail, and one application log) and two or three use cases that matter to your team.
- Ingest via managed connectors or your existing S3 pipeline, preserving raw logs while events normalize for search.
- Stand up a handful of targeted detections and entity dashboards, then run real investigations with the AI-assisted workflow.
- Tune with analyst feedback, using historical replay to validate threshold changes, and watch false positives drop.
Teams typically measure success in time to first meaningful alert, mean time to investigate behavioral incidents, and false positive reduction after tuning. All three tend to move within the first couple of weeks, not the first couple of quarters.
With this, our customers are using this to identify the UEBA they wanted all along: Anomalous login and access patterns, privilege escalation and admin abuse spotted across identity and cloud logs together, lateral movement surfaced by correlating service-account and user activity across applications, and investigations that produce a defensible, reproducible answer to "who did what" for incident response and audit.
UEBA without the baggage
Behavior analytics doesn't have to mean brittle heuristics or unexplainable ML. It should be entity-centric, fast enough that historical questions are routine, composable enough that weak signals add up to strong detections, and transparent enough that analysts trust what they're shown.
That's the version of UEBA we built. If you want to see it against your own logs, a POC takes days, not months. Book a demo and bring your hardest "who did what" question.