
Introducing Dashboarding in RunReveal
RunReveal introduces dashboarding. Create custom security graphs, layouts, and use AI chat to generate queries automatically.

Today we're announcing support for Dashboarding in RunReveal. Our customers can begin using this product immediately and we'll show you how to use it effectively in this blog post!
It was about 8PM and my day was winding down at a past job as a security engineer. My phone rang—it's a friend who's on the product team, "Hey, I was just randomly browsing your security dashboards and I saw failed logins to our website went through the roof earlier today. It's still at hundreds per second, and yesterday was at 1 or 2 per second. Are we under some type of attack? It looked wrong to me."
The powerful thing about dashboards is that anyone can look at one and visually see drastic changes. It's easy to look at a dashboard and think, "That's just eye candy, the real info is in the logs"—and most days, you're right. But dashboards are also phenomenal tools for identifying changes in your logs.
How do dashboards work?
To make this very complicated product simple to use we needed to consider how users would maintain individual graphs and then collections of graphs so they could see all their graphs on a single dashboard.
- Graphs: Single graphs that you can configure
- Layouts: Collections of graphs, along with their size
Graphs
Dashboards are just queries that run and then pass the results to a graphing library, along with the configuration of the graph we want to display. At RunReveal we chose to use Apache ECharts for our graphing library and we've found it's a powerful library that is fast, well-tested, well-documented, and capable of doing just about anything.
We wanted our graphs to feel as similar to the rest of RunReveal as possible, so they work exactly like RunReveal's detection queries. When you write a query for a dashboard, you'll write your query in a way to accept time and interval parameters. Additionally, you'll choose what type of graph you want to display along with other visual configuration.
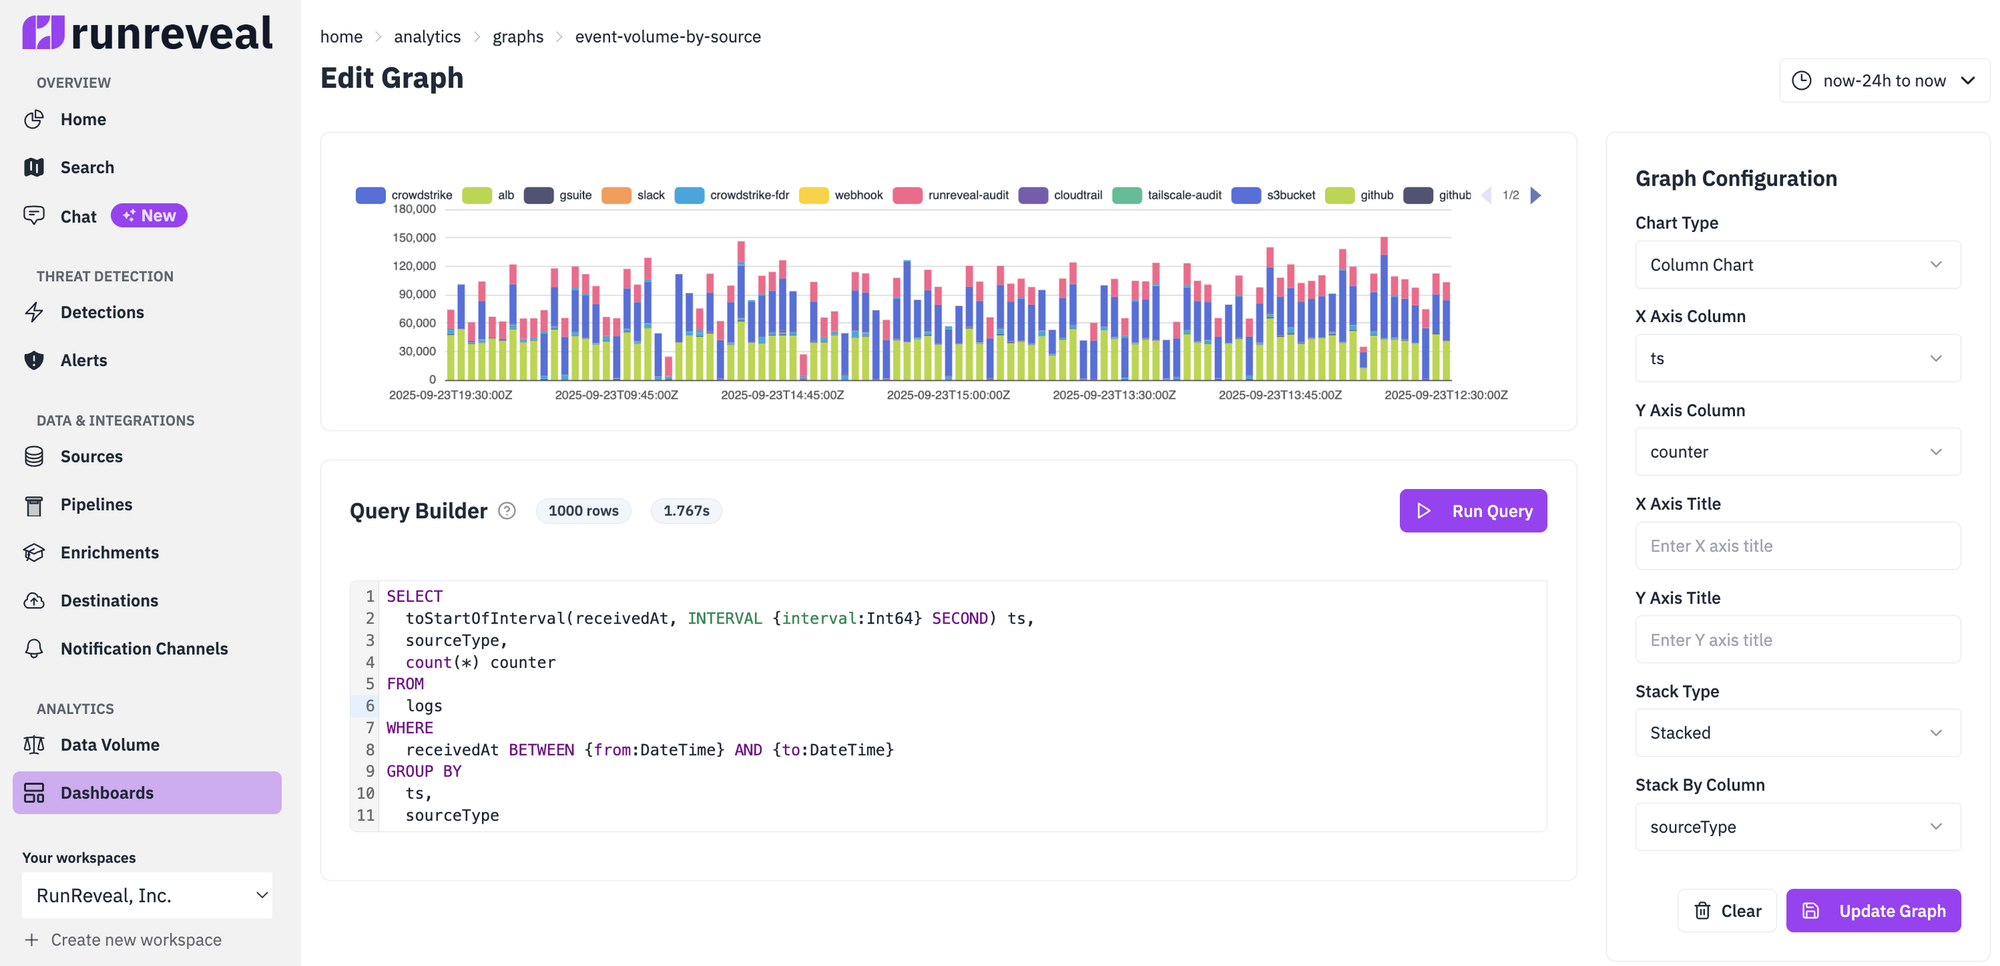
Above you can see every component of setting up a new graph in one place. You'll notice the query we run includes variables {from:DateTime} and {to:DateTime} , which are configured by the time picker in the top right. However, you'll also notice interval; we automatically pick a reasonable interval based on the from and to time.
I'm sure all that makes sense, but what about groups of graphs all on the same dashboard? For that we created layouts.
Layouts
When we created our layouts product we wanted to avoid making it overly complex and causing usability challenges, especially when it came to panel sizing.
Because of that, we decided we'd have two simple rules:
- Every panel has a configurable t-shirt size that plays nicely on a row with other sizes.
- When you exceed the length of a single row, the next panels will go to a new row.
We chose each row should have a 12 column width, and each graph should be assigned a width that's a factor of 12 (and we also added a width of 10, in case you wanted an almost full row). This ended up being really easy to implement, maintain, and use.
Making new graphs with chat
While testing the dashboarding product, we realized there were a lot of dashboards we wished we could give customers out of the box that we haven't yet developed. We're working on that.
For now, we were really surprised by how good the RunReveal Chat Agent was at making queries that could easily be dropped into our graphing feature and added to a layout.
Here's an end-to-end video of that working that I recorded in 1 take.
I gave the AI agent this not-fully-baked prompt, and from there I was easily able to take the output and turn it into a graph:
Can you look at my sourceType=alb logs and create a timeseries query that I can render a graph of http status code with? Test the queries normally and use receivedAt > {from:DateTime} and receivedAt <= {to:DateTime} for framing when you present the query to me, and when grouping by an interval group normally but when displaying the final queries to me use the variable {interval:Int64}
This result is amazing and a true testament to how good the AI models of today have gotten, especially when provided well-structured data and the ability to fix their mistakes!
Until we can build out-of-the-box dashboards we hope this helps you make use of the feature quickly.
What's next
RunReveal is continuing to build the security data platform of the future. We work daily with our customers on the features they want, the bugs they run into, and oftentimes we surprise them with features they didn't know they wanted.
Our entire stack is written in Go and Next.js, and if you're interested in joining us, check out our careers page.