
Announcing Impossible Travel Detection
Impossible travel detections are critical to detect compromised users in your organization.


Today we’re announcing Impossible travel detection across all RunReveal log sources. This is available for all of our customers immediately, including our free tier.
The past three years have reminded us that social engineering attacks never went out of style. With just a phone call and a pixel perfect phishing page (powered by evilginx2), hacking groups simply logged into valid corporate identities after tricking dozens of companies into exposing passwords and 2fa codes.
Looking for impossible travel can help spot these scenarios. These types of detections work by looking at the IPs from your security logs, determining the locations associated with those IPs, and calculating the speed that each employee would have had to travel to be present at each location. If a user's speed is unnaturally high then it's a helpful signal that the user is compromised.
Today we're enabling all of our customers to look for impossible travel across all of their log sources and this alert will only get better as we add more sources in the future.
Enriching every log
When we started working on this product we wanted all logs to be usable for impossible travel detection, not just a few chosen log sources. All of the logs we collect are written to the runreveal_logs table and are presented in separate tables using materialized views.
The runreveal_logs table has separate srcIP and dstIP addresses that were already a standard column that every log has. This led us to add new columns to the table for each field of enriched data we wanted to add.
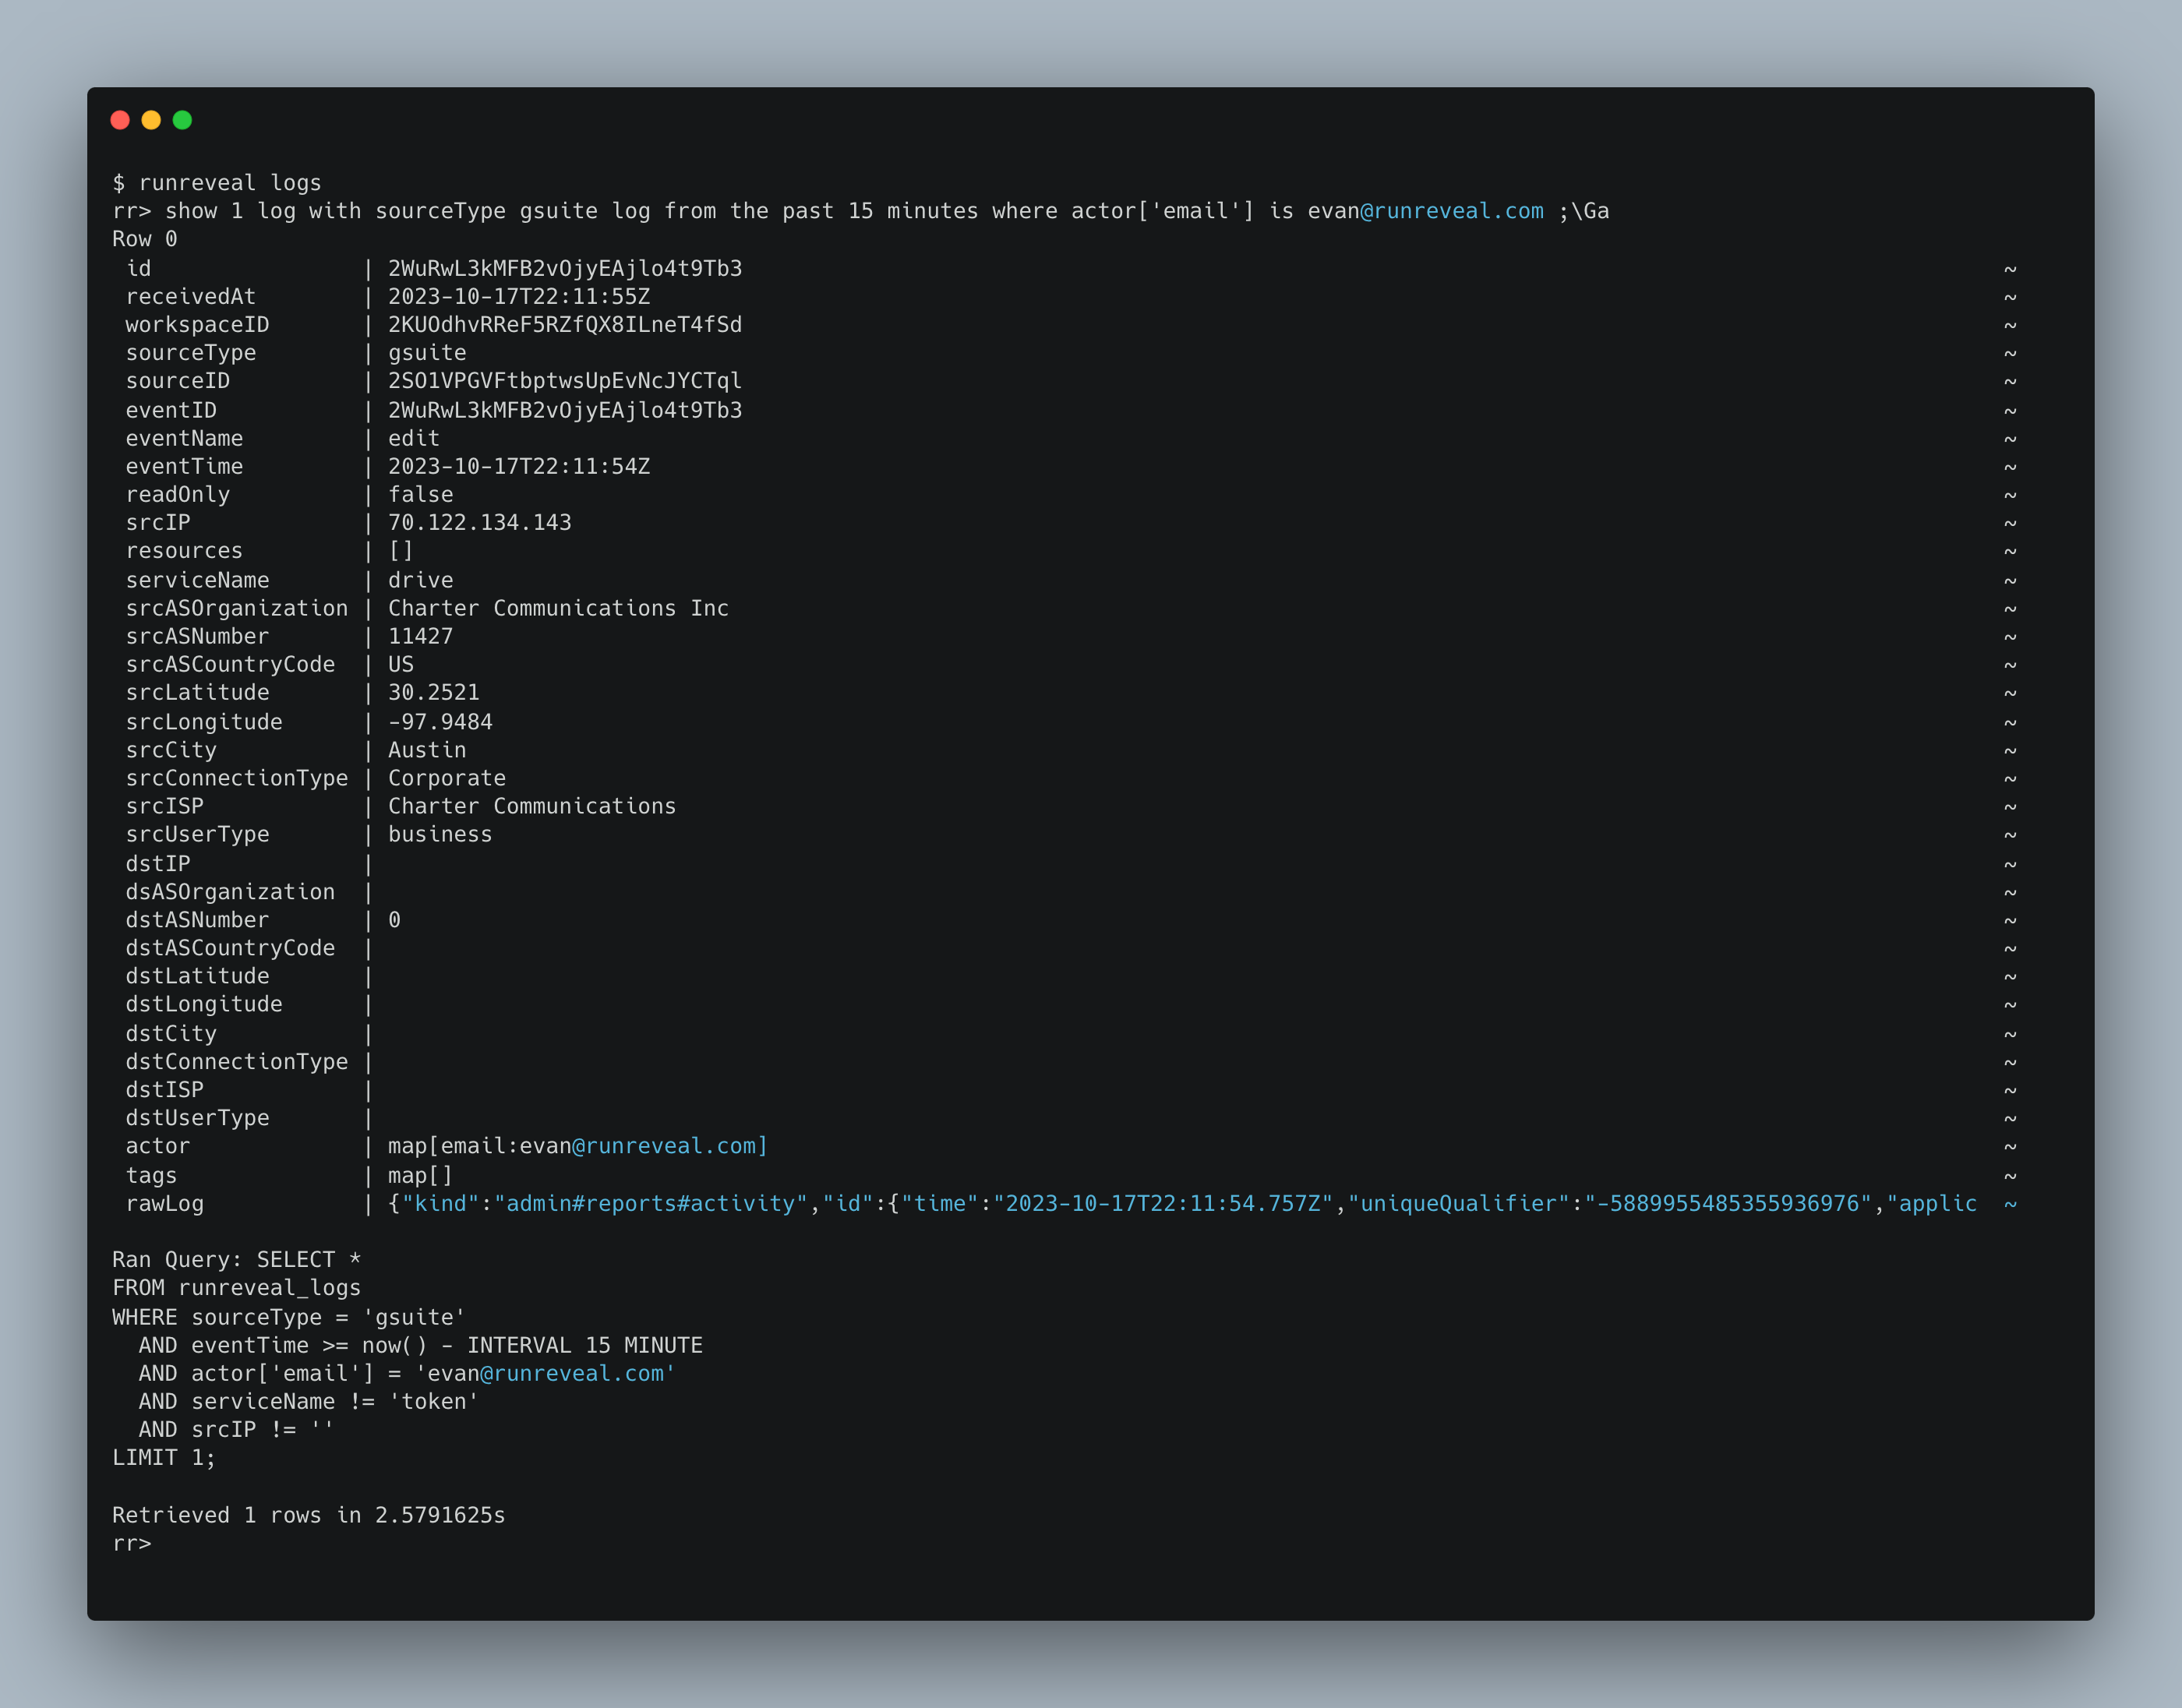
We added quite a few columns for both source and destination IP address.
- AS Organization - The Autonomous System name associated with the IP
- AS Number - The Autonomous System number associated with the IP.
- Latitude - The latitude of the IP
- Longitude - The longitude of the IP.
- City - The city the IP is associated with.
- ConnectionType - Whether or not this is a business or residential.
- ISP - The Internet Service Provider of the IP address.
- UserType - More granular version of connection type indicating mobile, hosting provider, residential, etc.
To render the enriched data from the IP address we used a third party database. These IP databases are files in the mmdb format. The mmdb format is a binary file format that stores the IP data in a binary search tree and is built to be very fast. We're using the maxminddb-golang library to search the file and found it to as performant as we expected in our pretty basic benchmarks of searching a million random IPs at a time.
$ go test -v
=== RUN   TestLookup
Iterations 100000, Elapsed Time: 2.417µs
Iterations 200000, Elapsed Time: 2.333µs
Iterations 300000, Elapsed Time: 250ns
Iterations 400000, Elapsed Time: 2.25µs
Iterations 500000, Elapsed Time: 2.334µs
Iterations 600000, Elapsed Time: 2.416µs
Iterations 700000, Elapsed Time: 3µs
Iterations 800000, Elapsed Time: 2.834µs
Iterations 900000, Elapsed Time: 2.542µs
Iterations 1000000, Elapsed Time: 3.292µs
--- PASS: TestLookup (4.01s)
PASS
ok      github.com/runreveal/runreveal/internal/enrichments     4.108s
We added a Lookup to our main queue process et voilà, we started to enrich every single log we process without scalability concerns or the complexity of introducing network i/o.
Calculating impossible travel
Now that each log has a longitude and a latitude associated with the IP addresses we needed to calculate when impossible travel had occurred. Despite what flat-earthers might say, this is slightly more complex than calculating the speed between two points on a cartesian plane due to Earth's remarkable resemblance to a sphere.
To calculate the distance between two points we used ClickHouse's geoDistance function. The geoDistance function under the hood uses two different methodologies and returns the distance between two points in meters. The code is fairly readable and has helpful comments.
- Flat Ellipsoid Formula. Used when the longitude difference between two points is small. This method is the standard 2D euclidian distance formula but with extra lookup tables that account for the earth's curvature. This method is simple, but isn't accurate at large distances.
- Haversine Formula. Used when points are far apart. Calculates the "Great Circle Distance" and uses trig functions to calculate the distance between two points over the face of a sphere. Doesn't account for altitude or Earth being an ellipsoid but still very accurate.
We concluded the precision and methodologies used by geoDistance was more than enough for our purposes. Next, we needed to develop a function that our customers could run to calculate a user's speed.
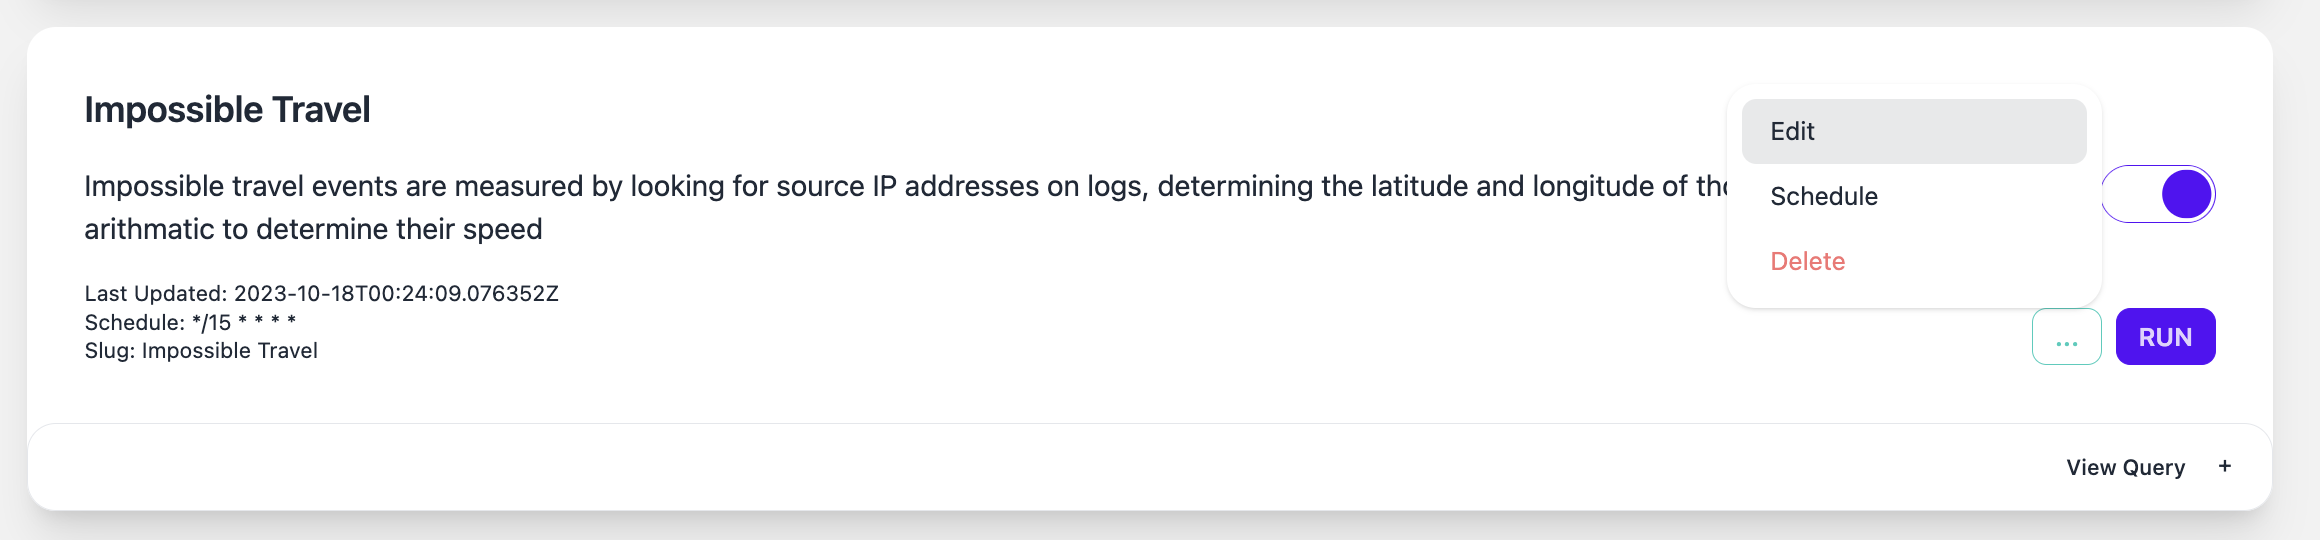
Using our scheduled queries feature, we wrote a query that runs in our customer's accounts every 15 minutes that:
- Looks for all locations over the past 24 hours from each actor in your organization.
- Compares all points from each actor over the past 15 minutes to the previous 24 hours, and calculates the geoDistance between them.
- Determine the users velocity by dividing the distance in meters by the difference in each previous event's speed in seconds.
- Look for events that exceed a "reasonable" speed.
We decided that "reasonable" was roughly the speed of sound. In reality, this can be much higher and the alert will still work well.
Implementing impossible travel
In theory, there should be no issues implementing the above steps, right? Well expressing this type of thing in any language can get complicated. We implemented this methodology in clickhouse SQL and the result isn't pretty but it is fast.
Structurally the query has three main parts. Let's look at each section and work backwards to understand it.
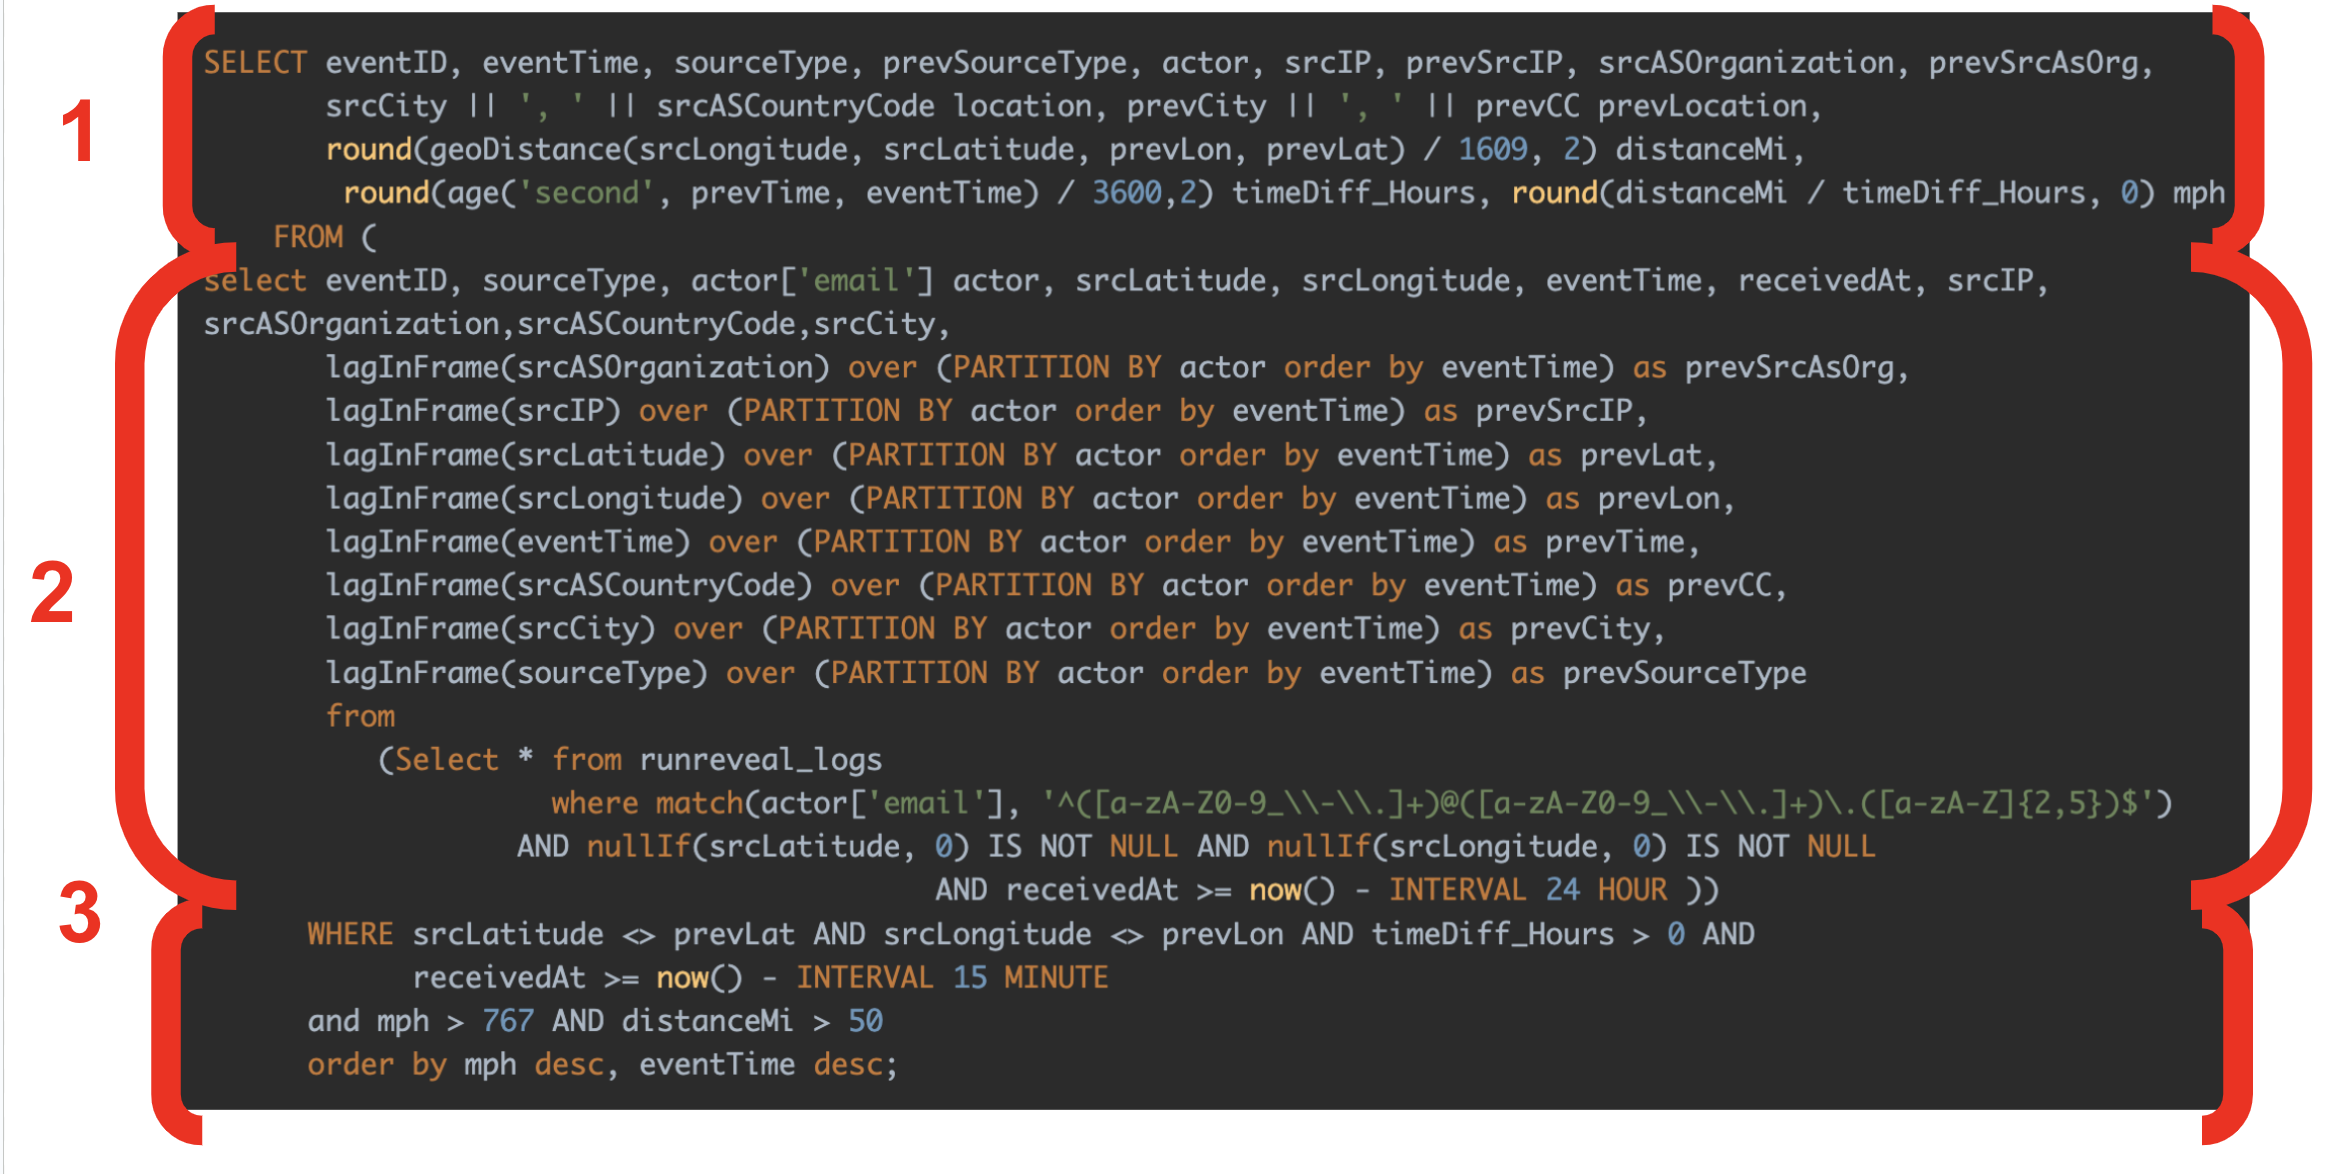
Section 3 is selecting the logs for each actor in the previous 15 minutes, ensures that any rows we return indicate that the user has traveled as fast as the speed of sound(ish), and enforces a 50 mile margin of error.
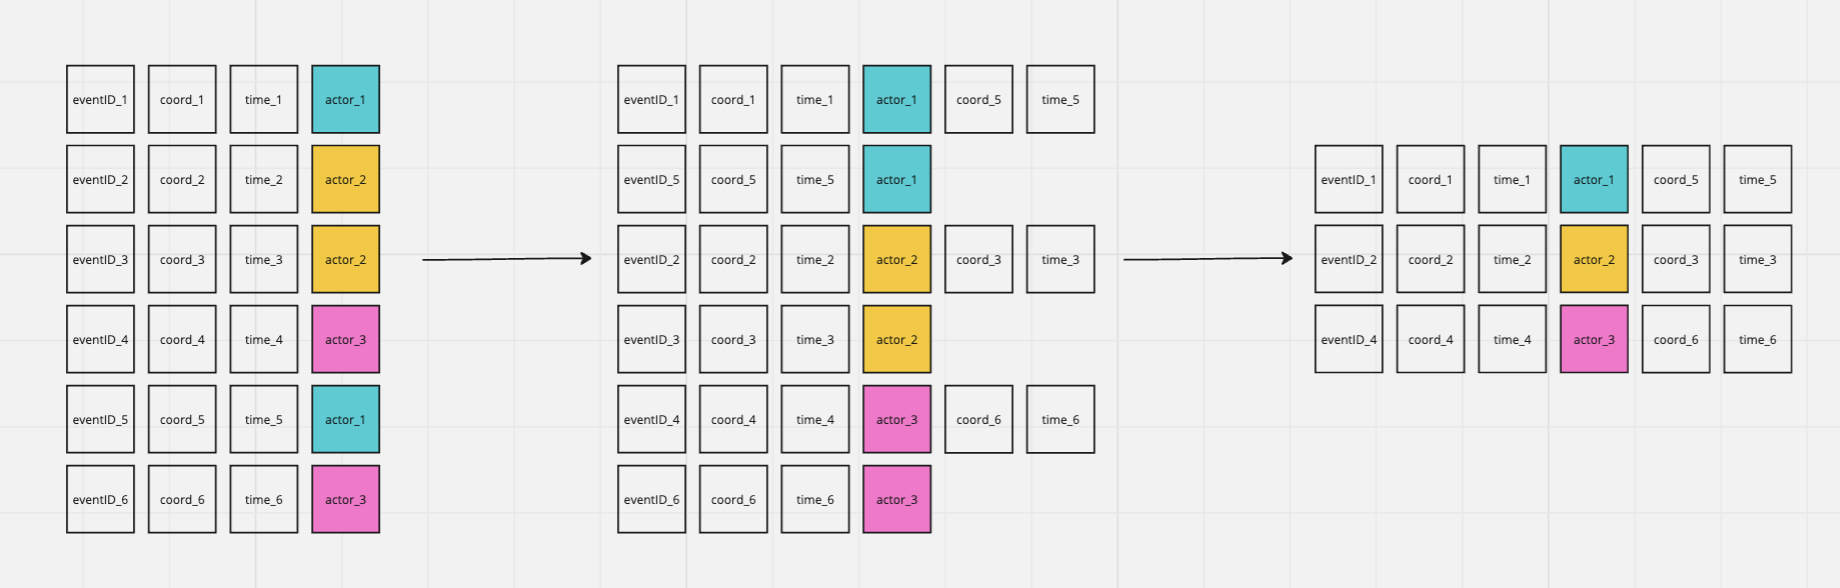
Section 2 is the most complicated section. It first looks at all logs over the past 24 hours. Next it uses the lagInFrame windowing function to group the logs by actor in the partition statement, order them by eventTime, and then lastly return the rows along with the actor's previous coordinates and time. The lagInFrame function is probably not familiar to most, but the below graphic illustrates these steps and what's going on.
Section 1 looks at each row from Section 2, and calculates the miles per hour that the user traveled by using the geoDistance calculations on the previous and current coordinates.
It's important to note that it is not uncommon for third party SaaS services to perform actions on behalf of the user they are accessing data for, which ... appears to be an awful lot like malicious activity. This meant it was important that each customer's query is unique to them so you can modify or tune your query for the best results. By limiting the third section's where clause to specific sourceType values it's easy to exclude different log providers.
What's next?
RunReveal is going to continue helping our customers get quick usage from their logs. We'll likely continue to integrate third party services to help enrich logs, adding log support for more log sources that our customer's want to monitor, and we'll likely improve this query in the near future.
We're hiring and looking for great product engineers who can help us build the future of security data.
If you need help with your security logs, want a demo, or just want updates fill out this form and we'll be in contact with you soon. Now nothing is stopping you from setting up impossible travel detection today!